- Splunk Answers
- :
- Using Splunk
- :
- Splunk Search
- :
- server status on dashboard
- Subscribe to RSS Feed
- Mark Topic as New
- Mark Topic as Read
- Float this Topic for Current User
- Bookmark Topic
- Subscribe to Topic
- Mute Topic
- Printer Friendly Page
- Mark as New
- Bookmark Message
- Subscribe to Message
- Mute Message
- Subscribe to RSS Feed
- Permalink
- Report Inappropriate Content
server status on dashboard
- Mark as New
- Bookmark Message
- Subscribe to Message
- Mute Message
- Subscribe to RSS Feed
- Permalink
- Report Inappropriate Content
Hi @sphiwee,
you can see in Dashboard Examples (https://splunkbase.splunk.com/app/1603/) in the "Table Icon Set (Rangemap)" dashboard how to display status using an icon instead a value.
In few words, you have to add to your app a css and a js (that you can find in Dashboard Examples) called by the dashboard
<form script="table_icons_rangemap.js" stylesheet="table_decorations.css">
then you have to assign an id at your table:
<table id="table1">
At the end, you have to add to your search the rangemap command, something like this:
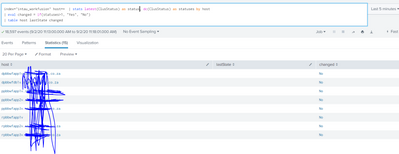
index=intau_workfusion host=*
| stats dc(ClusStatus) AS statuses BY host
| rangemap field=statuses severe=0-1 low=2-1000000000 default=severe
| table host range
In this way if statuses=0 or 1 you have a red icon and statuses>1 you have a green icon.
if you want to change the name of the range column, you have to modify also the table_icons_rangemap.js file.
Remember to restart Splunk after you added css and js to the app and reload the page at every change in the dashboard otherwise you don't see the icons.
Ciao.
Giuseppe

