Turn on suggestions
Auto-suggest helps you quickly narrow down your search results by suggesting possible matches as you type.
Showing results for
Splunk Search
Turn on suggestions
Auto-suggest helps you quickly narrow down your search results by suggesting possible matches as you type.
Showing results for
- Splunk Answers
- :
- Using Splunk
- :
- Splunk Search
- :
- Split trellis over two variables
Options
- Subscribe to RSS Feed
- Mark Topic as New
- Mark Topic as Read
- Float this Topic for Current User
- Bookmark Topic
- Subscribe to Topic
- Mute Topic
- Printer Friendly Page
- Mark as New
- Bookmark Message
- Subscribe to Message
- Mute Message
- Subscribe to RSS Feed
- Permalink
- Report Inappropriate Content
Split trellis over two variables
yifatcy
Path Finder
05-10-2021
03:21 AM
Hi,
Can I separate Trellis visualization by two variables as keys? In other words, I would like a timechart for each combination of the two variables.
(variable2_1 for example is an instance in variable2 column)
My goal is to have:
For now I succeeded either doing:
| stats max(variable1) by variable2, variable3
| stats max(variable1) by variable2, variable3
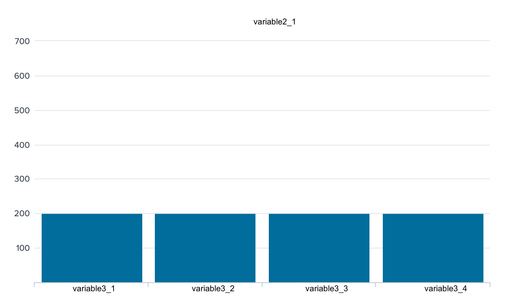
and the output (one of the Trellis for example):
But I wanted a timechart and a separate histogram for each combination of variable 2 and 3.
I also tried:
| timechart max(variable1) by variable2, variable3
which doesn't work.
Could you kindly assist? the aggregation section in Trellis also doesn't seem to produce the wanted results.
Thanks.
Get Updates on the Splunk Community!
Index This | I’m short for "configuration file.” What am I?
May 2024 Edition
Hayyy Splunk Education Enthusiasts and the Eternally Curious!
We’re back with a Special ...
New Articles from Academic Learning Partners, Help Expand Lantern’s Use Case Library, ...
Splunk Lantern is a Splunk customer success center that provides advice from Splunk experts on valuable data ...
Your Guide to SPL2 at .conf24!
So, you’re headed to .conf24? You’re in for a good time. Las Vegas weather is just *chef’s kiss* beautiful in ...


