- Splunk Answers
- :
- Using Splunk
- :
- Splunk Search
- :
- How would I prepare this availability calculator?
- Subscribe to RSS Feed
- Mark Topic as New
- Mark Topic as Read
- Float this Topic for Current User
- Bookmark Topic
- Subscribe to Topic
- Mute Topic
- Printer Friendly Page
- Mark as New
- Bookmark Message
- Subscribe to Message
- Mute Message
- Subscribe to RSS Feed
- Permalink
- Report Inappropriate Content
Hi Team,
I need a help in preparing a availability calculator.
Below graph is the requirement.
Current output form code below:
| DESCRIPTION | downtime | Time |
| QIT-LAG | 00:00:06 | 2022-07-31 |
| QIT-LAG | 00:00:09 | 2022-07-29 |
| QIT-LAG | 00:00:08 | 2022-07-29 |
| QIT-LAG | 00:00:10 | 2022-07-29 |
Current manual action:
1. Am extracting above table in excel,
2. converting all duration to seconds
3. grouing it with Day wise.
4. preparing a percentage loss out of 86400 (24*60*60) on each day is the graph.
CODE:
index=opennms
| search DESCRIPTION="QIT-LAG"

| transaction nodelabel startswith=eval(Status="DOWN") endswith=eval(Status="UP") keepevicted=true
| eval downtime=if(closed_txn=1,duration,null)
| eval downtime=tostring(downtime, "duration")
| fillnull value="" downtime
| eval Status=if(closed_txn=1,"UP","DOWN")
| rex field=downtime "(?P<downtime>[^.]+)"
| rename _time as Time
| fieldformat Time=strftime(Time,"%Y-%m-%d")

| table DESCRIPTION, downtime, Time,
Challenge:
how to convert the current downtime into seconds and also add it with day basis and prpeare a percentage basis graph.
Thanks In advance for guidance and help.
- Mark as New
- Bookmark Message
- Subscribe to Message
- Mute Message
- Subscribe to RSS Feed
- Permalink
- Report Inappropriate Content
You've done most the work already. Downtime was in seconds before it was converted to a string. Use the stats command to group results by day then use eval to compute the percentage loss.
index=opennms DESCRIPTION="QIT-LAG"
| transaction nodelabel startswith=eval(Status="DOWN") endswith=eval(Status="UP") keepevicted=true
| eval downtime=if(closed_txn=1,duration,null)
| fillnull value="" downtime
| rename _time as Time
| fieldformat Time=strftime(Time,"%Y-%m-%d")
| stats values(DESCRIPTION) as DESCRIPTION, sum(downtime) as total_downtime by Time
| eval pct_loss = (downtime * 100) / 86400
| table DESCRIPTION, downtime, Time, pct_loss
If this reply helps you, Karma would be appreciated.
- Mark as New
- Bookmark Message
- Subscribe to Message
- Mute Message
- Subscribe to RSS Feed
- Permalink
- Report Inappropriate Content
@richgalloway , thanks a ton for that suggestion, that worked up to an extend.
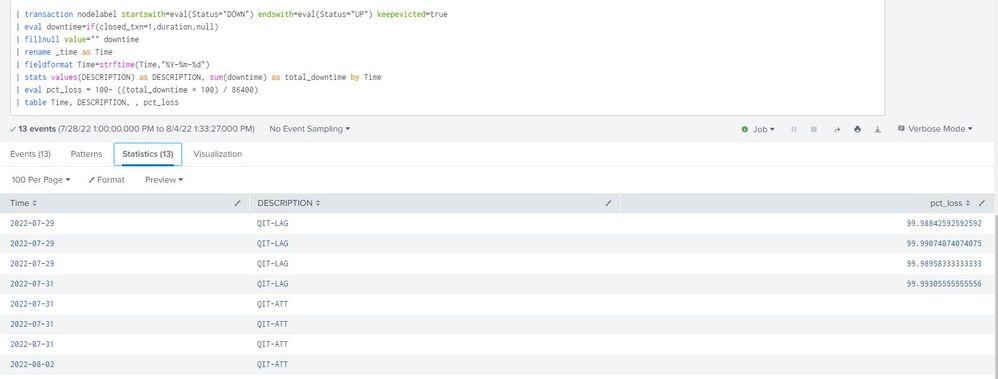
but there was some challenge. I have attached the output.
Gouping of those dates are not happening.
Expected output :
| 2022-07-29 | QIT-LAG | 99 |
| 2022-07-31 | QIT-LAG | 99 |
| 2022-07-31 | QIT-ATT | |
| 2022-08-02 | QIT-ATT | |
| 2022-08-02 | QIT-LAG | 98 |
| 2022-08-03 | QIT-LAG | 99 |
| 2022-08-04 | QIT-LAG | 97 |
ALso one more chalenge in removing the blank field, how can i Achieve it.
- Mark as New
- Bookmark Message
- Subscribe to Message
- Mute Message
- Subscribe to RSS Feed
- Permalink
- Report Inappropriate Content
I'm not sure why that didn't work. Let's try an alternative.
index=opennms DESCRIPTION="QIT-LAG"
| transaction nodelabel startswith=eval(Status="DOWN") endswith=eval(Status="UP") keepevicted=true
```Omit "blank" results```
| where closed_txn=1
| bin span=1d _time
| stats values(DESCRIPTION) as DESCRIPTION, sum(downtime) as total_downtime by _time
| eval pct_loss = (total_downtime * 100) / 86400
| rename _time as Time
| fieldformat Time=strftime(Time,"%Y-%m-%d")
| table DESCRIPTION, total_downtime, Time, pct_lossIf this reply helps you, Karma would be appreciated.


