- News & Education
- :
- Blog & Announcements
- :
- Product News & Announcements
- :
- Routing logs with Splunk OTel Collector for Kubern...
Routing logs with Splunk OTel Collector for Kubernetes
- Subscribe to RSS Feed
- Mark as New
- Mark as Read
- Bookmark Topic
- Subscribe
- Printer Friendly Page
- Report Inappropriate Content
The Splunk Distribution of the OpenTelemetry (OTel) Collector is a product that provides a way to ingest metrics, traces, and logs to the Splunk platform using an HEC. If you are a DevOps Engineer or SRE, you may already be familiar with the OTel Collector’s flexibility, but for those less experienced, this blog post will serve as an introduction to routing logs.
The idea of OpenTelemetry as a whole is to unify the data so it's suitable for every input and output and put some processors in between to make it possible to perform operations on data (such as transforming and filtering). You may already see that one of the biggest advantages of OTel Collector is its flexibility - but sometimes figuring out how to use it in practice is a challenge.
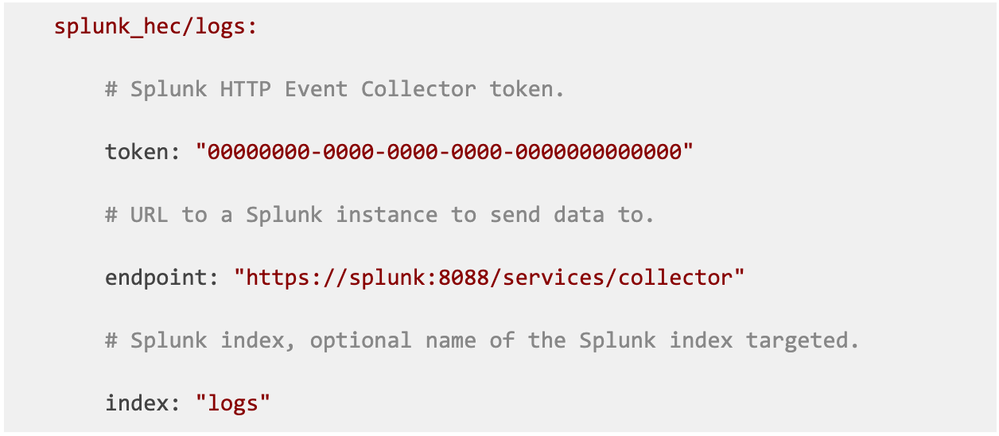
One of the most common cases in log processing is setting up the event’s index. If you’re familiar with the Splunk HEC receiver, you might recall this configuration snippet:
This indicates that every event used by this exporter will be sent to the logs index.
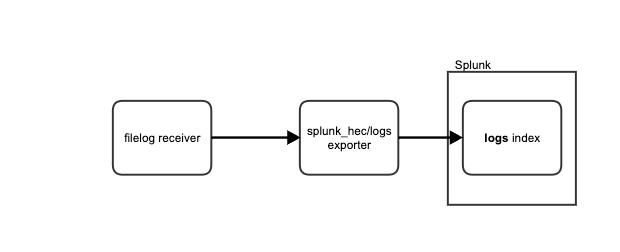
As you may see, the logs index is specific to an exporter, so the intuition is to create as many splunk_hec exporters as you need, and additionally create multiple filelog receivers as well, so that we can filter which files go to which index.
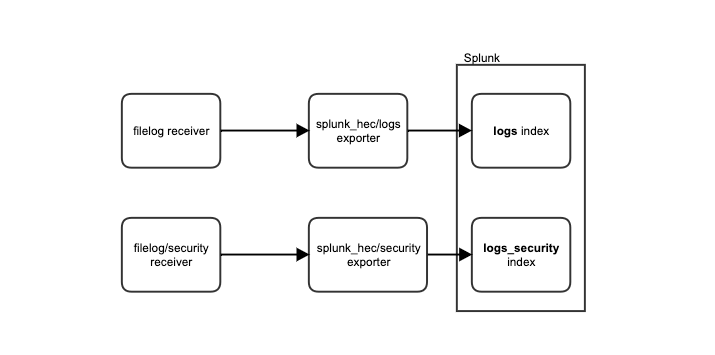
Using your imagination, visualize a scenario where all the logs go to the ordinary logs index, but some are only visible to people with higher permissions levels. These logs are gathered by filelog/security receiver and the pipeline structure would look like this one:
But is it really the best solution? Let’s consider a few questions here:
- splunk_hec exporter config seems to be the same, the only difference is the index field. Does it make sense to copy the configuration over and over?
- filelog receiver gives a way of configuring a place to gather logs. What about other filtering options, like ones based on severity or a specific phrase in the log’s body?
- Everytime we create a new pipeline, a new process comes to life - doesn’t this consume too many resources?
The solution: Dynamic index routing
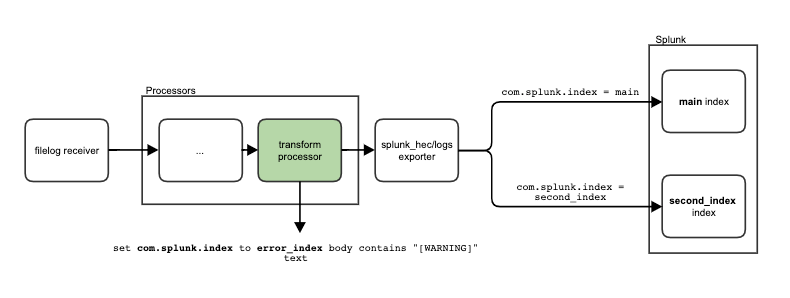
Today I’ll show you how to create a pipeline with dynamic index routing, meaning it is based on incoming logs and not statically set, with a transform processor and Splunk OpenTelemetry Collector for Kubernetes (SOCK). The idea is based on this attribute from Splunk HEC Exporter documentation:
This means that we can specify com.splunk.index as a resource attribute for a log, and it will overwrite the default index. Let’s go through a few examples of how we can do it in SOCK.
Viewing the pipelines configured in SOCK
Before we cover how to overwrite your pipelines, let’s start with how you can view the pipeline. The final config is the result of your configuration in values.yaml, as well as the default configuration that is delivered by SOCK. The config’s yaml file is in the pod’s configmap.
As logs are generated by the agent, you can look at the agent’s config, the command is:
Where my-splunk-otel-collector-otel-agent is the configmap’s name - it might differ in your case, especially if you chose a different name for an installation versus one from the Getting Started docs. You can take a look at a configmaps you have with the command:
An output example for a default namespace would be:
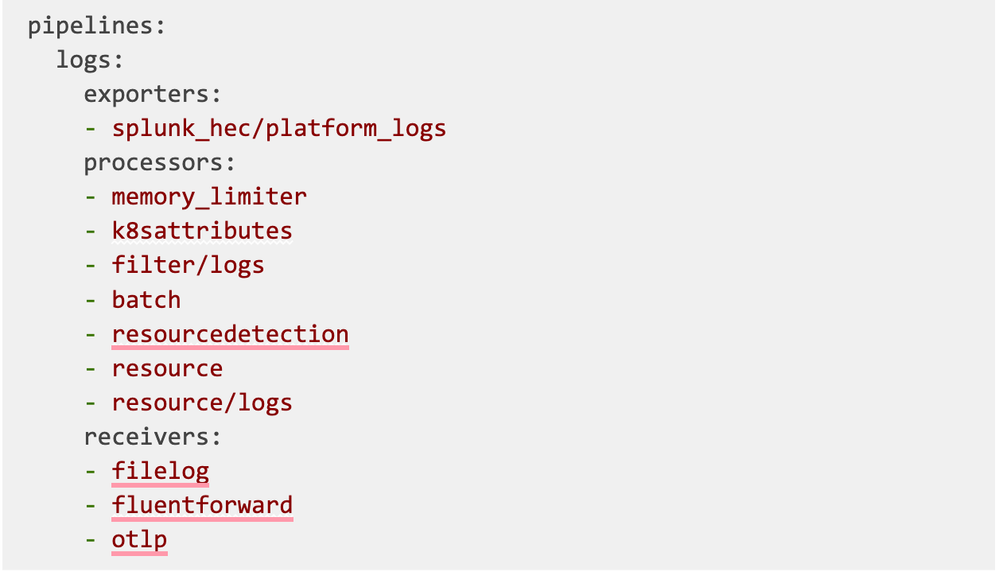
After successfully running the describe command, scroll all the way down until you see the pipelines section. For logs, it looks more or less like this:
Now you know what components your logs pipeline is made of!
Easy scenarios
Now let’s get our hands dirty! Let’s see the easy examples of index routing based on real scenarios.
Scenarios based on the log attribute
The scenario:
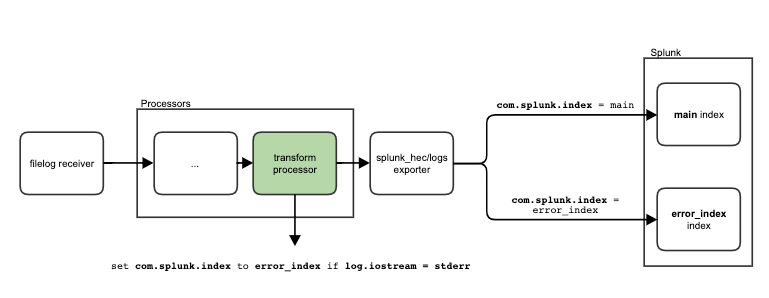
Let’s say we want to pass all the events with a log.iostream attribute stderr to error_index This would capture events emitted to the error stream and send them to their own index.
The solution:
This requires doing two things:
- Overwriting the default agent config with a new transform processor and adding it to the logs pipeline.
- Setting up the new processor’s statement to specify the correct target index.
Every transform processor consists of a set of statements. We need to create one that matches our use case, by defining what we need and writing it specifically for OTel. The logical statement here would be:
set com.splunk.index value to be error_index for EVERY log from the pipeline whose attribute log.iostream is set to stderr
Then the statement in the transform processor’s syntax described here looks like this:
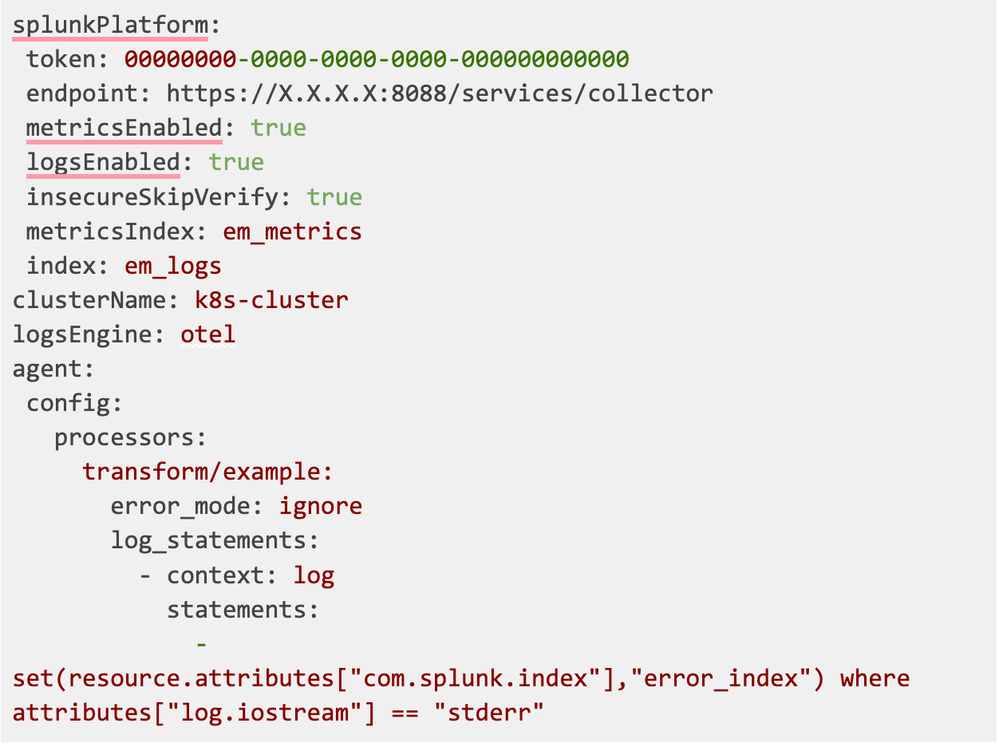
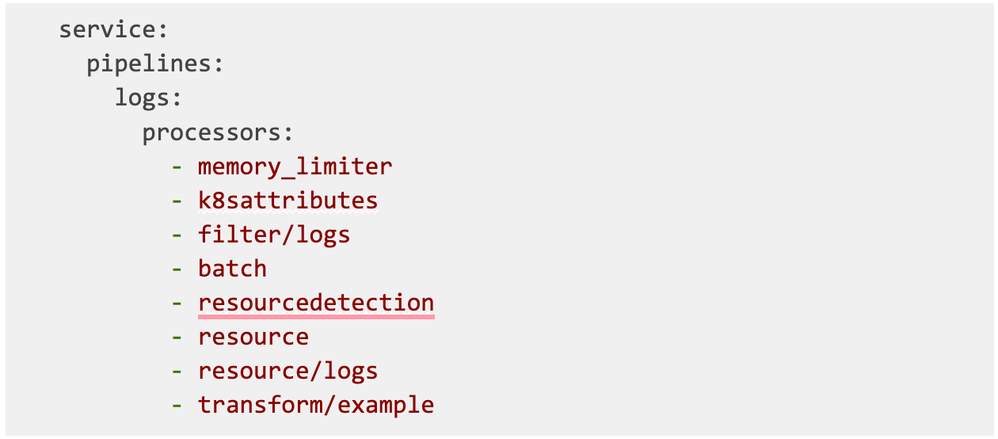
Next, we need to append the processor to the logs pipeline. To do that, we need to copy and paste the current processors under the agent.config section then insert our processor at the end.
The whole config will be:
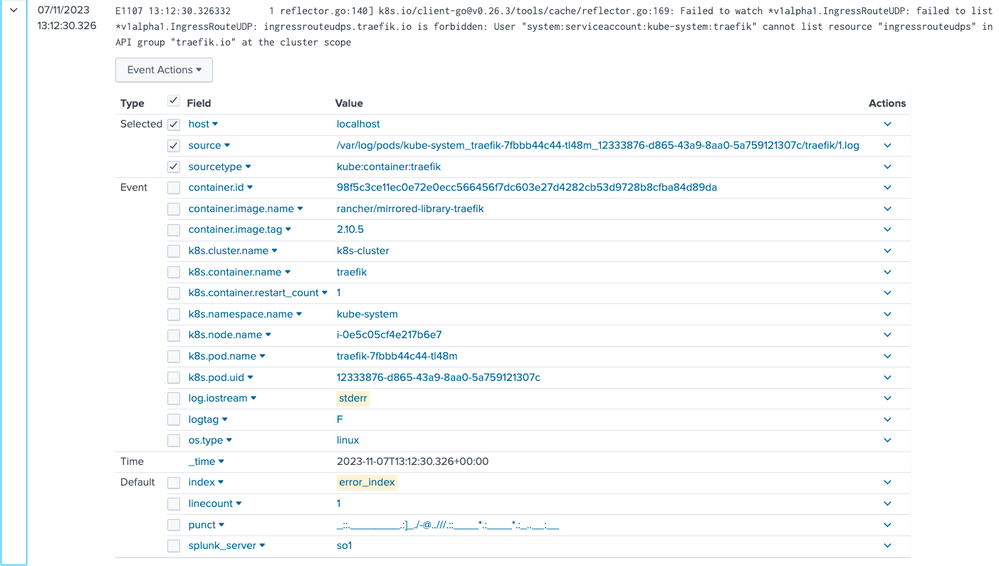
After applying the config, the stderr events appear in the error_index:
Scenarios based on specific log text
The scenario
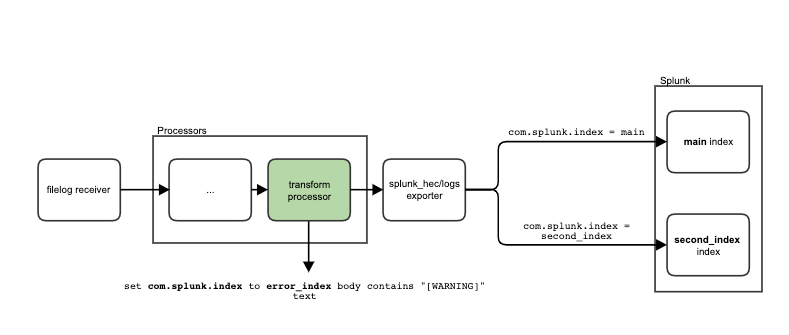
Passing an event to a different index when something specific is written in the body of the log, for example, every log that contains [WARNING]:
The solution
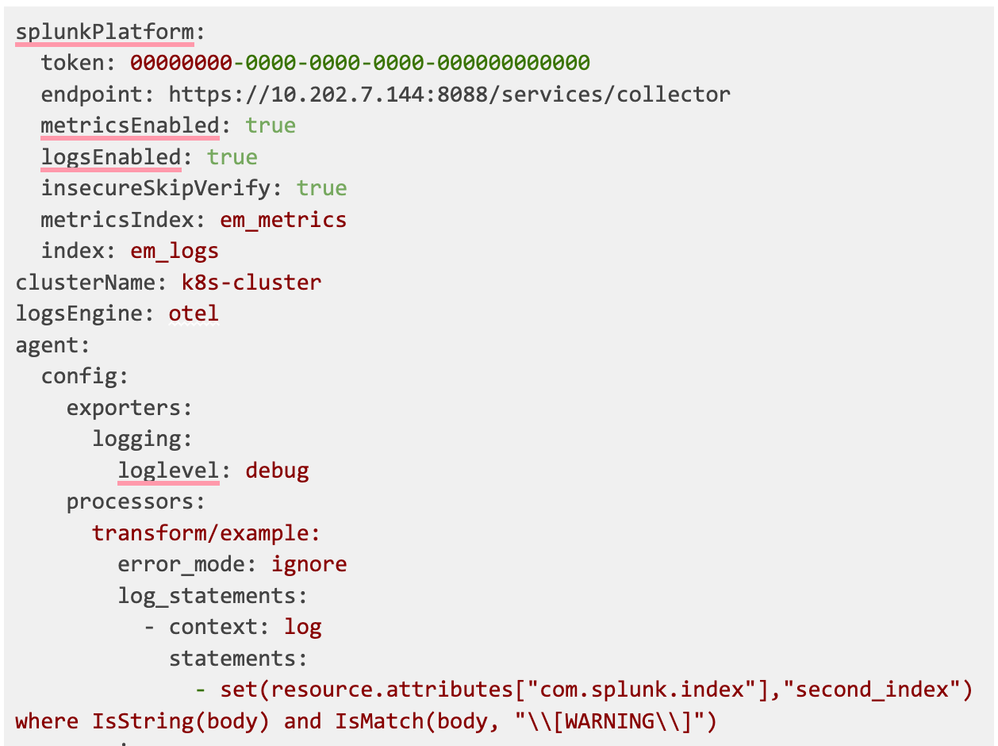
All the keywords used here come from the transform processor documentation. We can use the transform processor, this time using the following logic:
Here are some sources that can be used to learn more about OpenTelemetry Transformation Language and its grammar.
Then we repeat the steps described in the previous solutions section. The final config is:
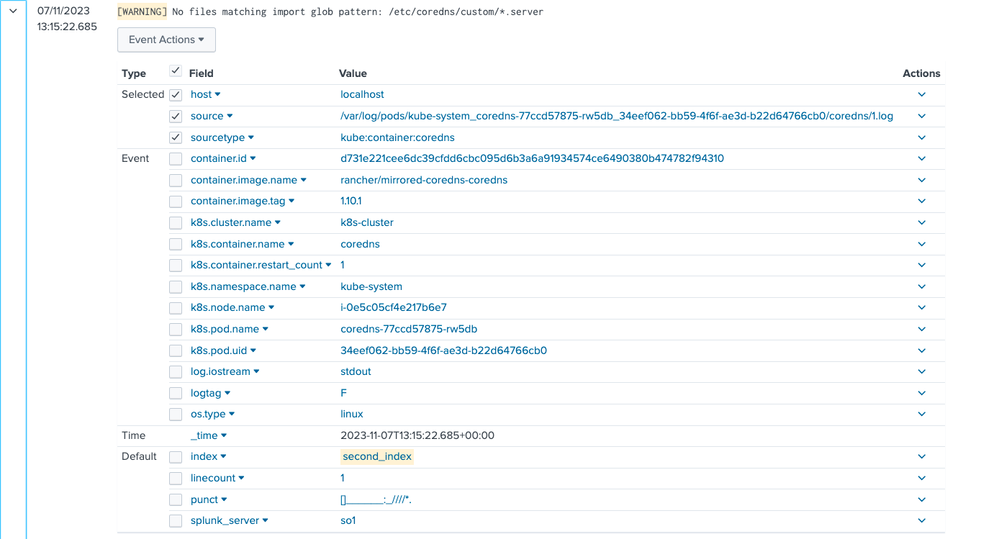
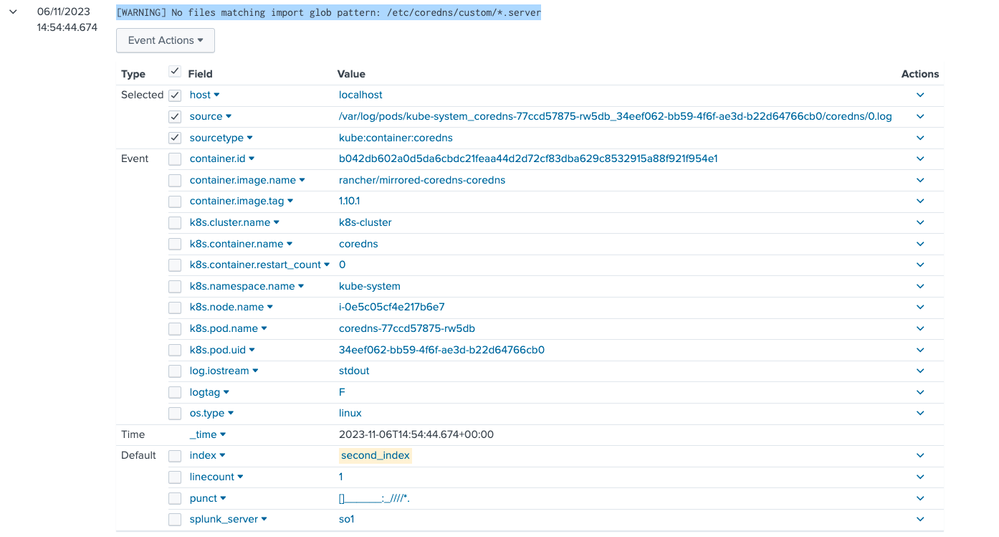
And the result in the Splunk Enterprise looks like this:
How do I know what attributes I can use?
At this point, you might think “Oh right, that looks easy, but how would I know what attributes to use?” The logs in the transform processor can use all the elements described here, but the most useful ones are:
- body - referring to the log body
- attributes - referring to the attributes specific to a single log
- resource.attributes - referring to the attributes specific to multiple logs from the same source
You can see them in the Splunk Enterprise event preview:
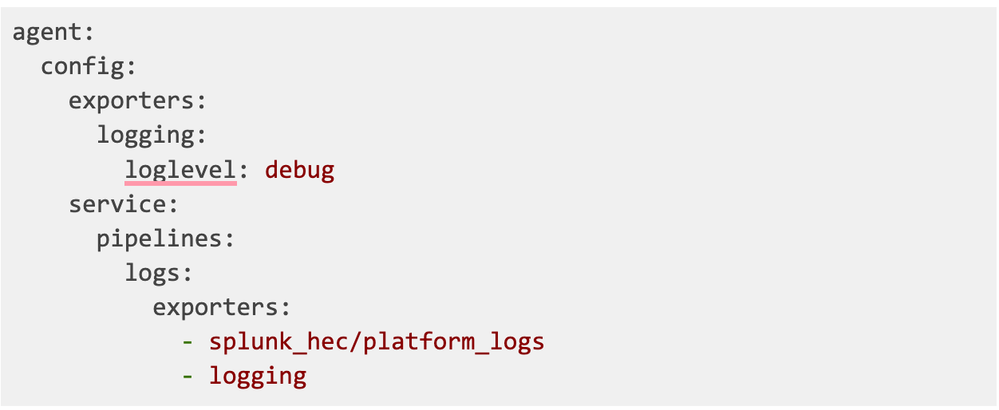
However, there’s no indication as to which dimensions are attributes and which are resource.attributes. You can see how it looks by running your OTel agent with this config:
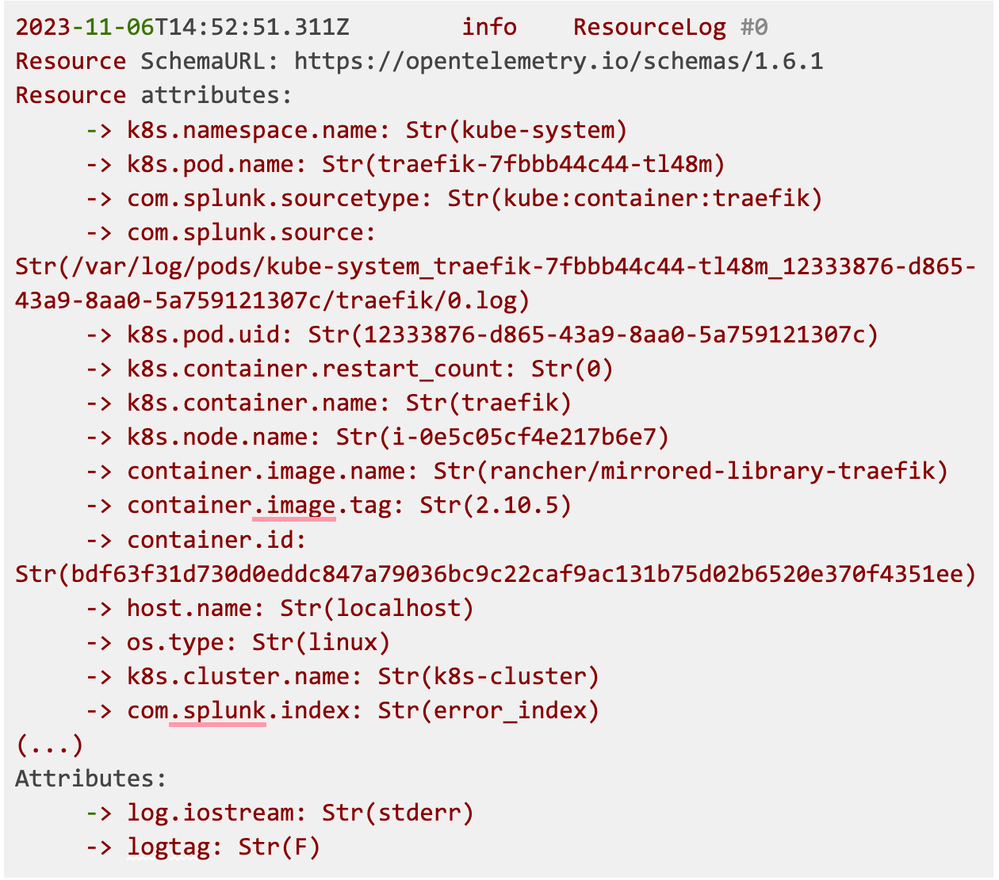
This will produce all the information about log structure and which attributes are really the resource.attributes:
From this snippet, you can see that only logtag and log.iostream are attributes, all the rest are part of the resource.attributes.
The transform processor has many options aside from the ones described above, check them out here.
Complex Scenarios
Let’s go even deeper and operate on two variables instead of one.
Scenarios based on setting index-based annotations
You may want to annotate the whole namespace with one splunk.com/index, but want specific pods from this namespace to redirect somewhere else. You can do this by using a transform processor to provide additional annotations to the pod of your choice.
Let’s say the annotation is second_index. This is how it looks in kubectl describe of the pod:
Transforming annotation into resource.attribute
First, redirect logs from the pods according to the second_index annotation to convert the annotation to a resource.attribute. This can be done with extraAttributes.fromAnnotations config:
tag_name is the identifier of an element in resource.attributes, it is optional. If you don’t configure it your attribute will look like this:
k8s.pod.annotations.<key>is the output format.
With tag_name you can decide how the name of your attribute, in this example it is the same as the key:
Make OTel pass logs to the index
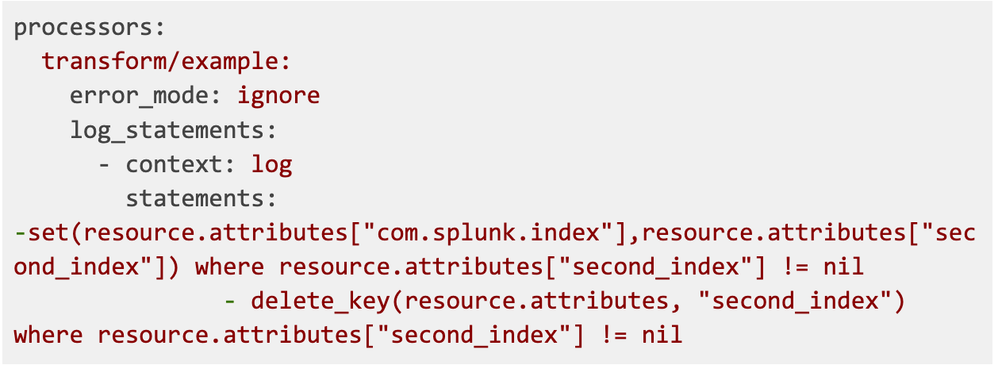
Now that we have resource.attribute second_index set up, we can set the index destination for logs. We will use transform processor for this purpose:
We will replace the com.splunk.index resource attribute with the second_index attribute, but only when the second_index attribute is present - so it doesn’t affect logs from other pods.
Delete unnecessary attributes
Once the attribute has been moved to the log's index, we can get rid of it. This requires adding another statement to the transform processor:
Scenarios based on labels setting the index
This will work exactly the same as an annotation example from the previous section, the only difference is in how we’re transforming the label into resource.attribute. We now have the second_index label on a pod:
We can make it visible to the OTel collector with this config snippet:
Conclusion
In this article, I showed you how to route logs to different indexes. It is a commonly used feature and it can be used in many scenarios, as we can see in the examples. We will expand on other SOCK features in later articles, so stay tuned!
You must be a registered user to add a comment. If you've already registered, sign in. Otherwise, register and sign in.
A Guide To Cloud Migration Success
Join Us for Splunk University and Get Your Bootcamp Game On!
.conf24 | Learning Tracks for Security, Observability, Platform, and Developers!
-
Customer Experience
9 -
Data Stream Processor
1 -
Edge Processor
2 -
OpenTelemetry
1 -
other
7 -
Product Announcements
1 -
Splunk APM
20 -
Splunk Cloud Platform
62 -
Splunk Community
1 -
Splunk Enterprise
45 -
Splunk Enterprise Security
43 -
Splunk Infras Monitoring
17 -
Splunk ITSI
11 -
Splunk Lantern
1 -
Splunk Mission Control
4 -
Splunk Observability Cloud
79 -
Splunk On-Call
2 -
Splunk Security Cloud
21 -
Splunk SOAR
15 -
Splunk UBA
2 -
Splunkbase Apps & Add-Ons
16 -
User Groups
1
- « Previous
- Next »
