- News & Education
- :
- Blog & Announcements
- :
- Community Blog
- :
- Tech Talk | Elevating Digital Service Excellence: ...
Tech Talk | Elevating Digital Service Excellence: The Synergy of Splunk RUM & APM
- Subscribe to RSS Feed
- Mark as New
- Mark as Read
- Bookmark Topic
- Subscribe
- Printer Friendly Page
- Report Inappropriate Content
Elevating Digital Service Excellence: The Synergy of Real User Monitoring and Application Performance Monitoring
In today's digital landscape, the adoption of Splunk Real User Monitoring (RUM) and Splunk Application Performance Monitoring (APM) is pivotal for organizations aiming to enhance their web presence and user experience. RUM is diligently employed to monitor the genuine interactions of users with web and mobile applications, providing a granular view of user experience in real-time.
Concurrently, APM is harnessed to investigate application performance, offering critical insights into transaction speeds and system health. Both are integral components of an observability suite that caters to the multifaceted nature of modern digital ecosystems, which encompass on-premise, hybrid, and multi-cloud environments. The integration of RUM and APM is showcased as a strategic move within a growth engineering team, underscoring its significant role in improving marketing operations and public-facing websites.
By using observability tools, we can take a preemptive and informed approach to delivering digital services. This shifts incident management from reactive to showcasing digital resilience and excellence.
Understanding Splunk RUM and APM in Observability Practices
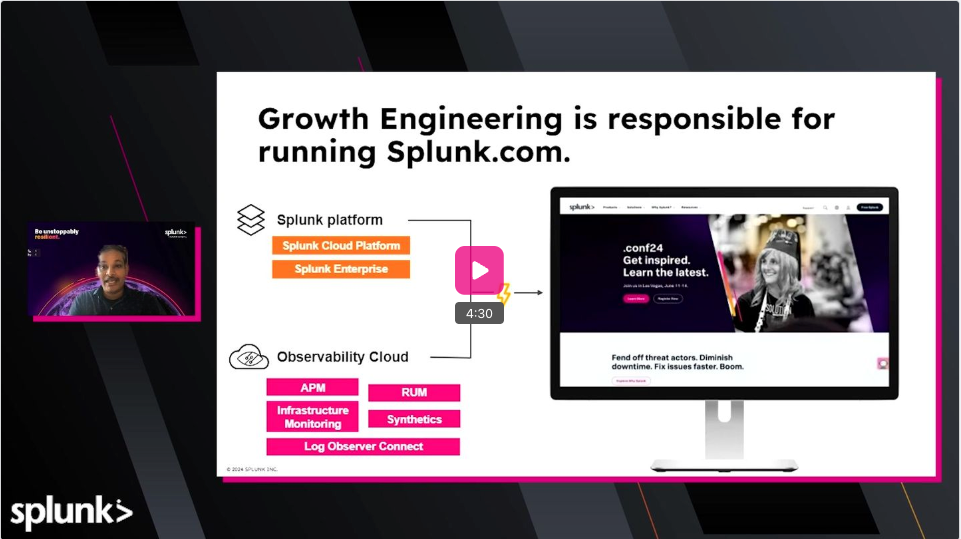
Driving Customer Experience With Splunk Observability: A Growth Engineering Team's Story
Learn how the growth engineering team at Splunk adopted Splunk Observability to improve incident detection, resolution, and customer experience. Watch
Real User Monitoring (RUM) and Application Performance Monitoring (APM) are essential components of Splunk's observability suite. Their adoption by Splunk's growth engineering team signifies a strategic move towards enhancing the company's marketing operations and public-facing websites. RUM is integral for monitoring the actual experiences of users interacting with web and mobile applications, while APM focuses on the performance of applications, offering insights into transaction speeds, error rates, and system health.
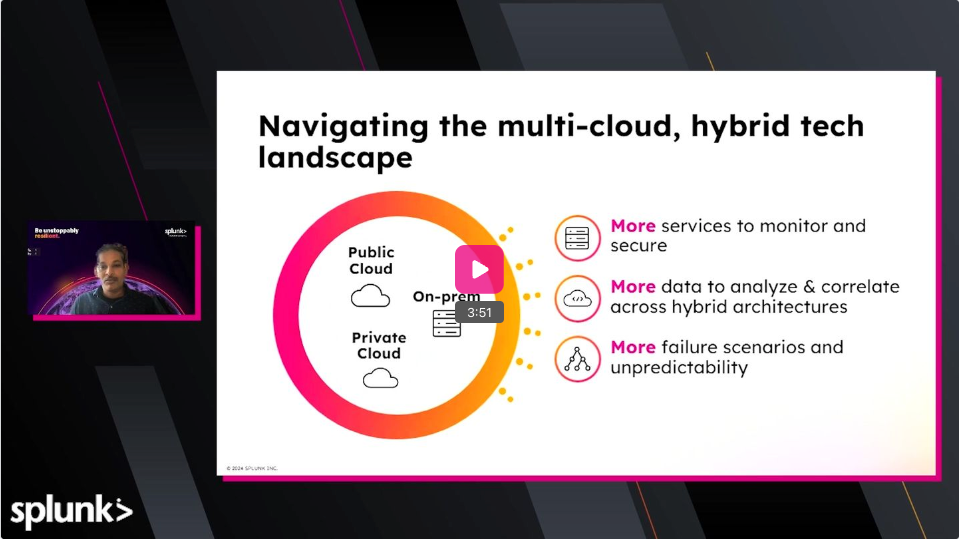
Splunk's observability products offer a unified solution for monitoring digital ecosystems that span across on-premise, hybrid, and multi-cloud environments, addressing the complexities that come with integrating multiple technologies and services. By adopting Splunk observability, organizations can achieve digital resilience, enabling them to recover swiftly from disruptions, adopt new operating models quickly, and ensure reliable and outstanding digital experiences for their customers.
The growth engineering team within Splunk's marketing organization is a prime example of how internal teams are leveraging these tools to improve efficiency, detect incidents faster, and align business priorities. The team's journey to utilizing RUM and APM has led to impressive results, such as faster page load times, increased engineering efficiency, and significant improvements in core web vitals.
These improvements are a testament to the power of a comprehensive observability strategy, which can transform reactive incident management into a foresighted approach to digital service delivery.
The Growth Engineering Team's Path to Digital Resilience
Leveraging Splunk Observability for Complex Technology Stacks
Explore how Splunk transitions its AEM stack to the cloud and leverages Splunk Observability to manage complex technology ecosystems and deliver exceptional customer experiences. Watch now
The Growth Engineering Team at Splunk has embarked on a digital resilience journey, with the mission to maintain public-facing websites and internal portals. Their objective is to provide a world-class customer experience by leveraging the power of Splunk products. To achieve this goal, the adoption of observability tools became imperative to address inefficiencies and the apparent lack of service health visibility.
With the introduction of Real User Monitoring (RUM) and Application Performance Monitoring (APM), the team is now equipped to detect incidents, isolate and prioritize events, and accelerate root cause analysis effectively. This strategic move has enabled the team to transform from a reactive to a forward-thinking approach, enhancing their ability to recover quickly from disruptions and adopt new operating models seamlessly.
The adoption of Splunk's observability tools has proven to be a critical step in the team's journey towards digital resilience. Observability has provided the team with end-to-end visibility, allowing them to monitor the health of their services and correlate events across different teams and microservices. This unified perspective is essential for resolving issues rapidly and efficiently.
As a result of these efforts, the team has reported significant improvements in key performance indicators, including faster page load times, increased engineering efficiency, and improved core web vitals. The team's utilization of RUM has been particularly impactful, allowing them to track automated user sessions across websites and applications. For instance, when trial sign-ups on the website were failing, RUM enabled the engineering team to quickly identify and resolve the issue, minimizing the potential impact on users. Similarly, APM has been instrumental in ensuring the performance of business-critical workflows.
During a product release, APM allowed the team to address an outage alert swiftly, maintaining a 99.9% uptime and boosting engineering productivity by 50%.
Overall, the integration of RUM and APM has set the stage for a more resilient digital presence, empowering the Growth Engineering Team to deliver superior customer experiences and drive business success. This journey towards digital resilience serves as a testament to the power of observability tools in optimizing user experience and operational efficiency.
Maximizing Digital Resilience: The Power of APM and RUM in Action
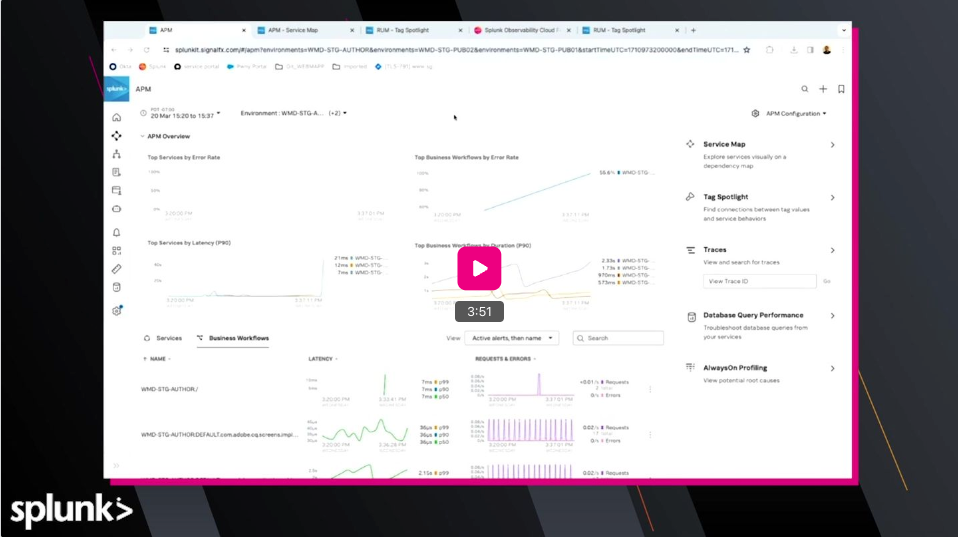
Comprehensive Application Performance Monitoring and User Experience Analysis With Splunk APM and RUM
Discover how Splunk APM provides distributed tracing and detailed error capture, while RUM offers real-time user experience monitoring and error tracking. Watch now
Application Performance Monitoring (APM) and Real User Monitoring (RUM) are crucial for ensuring service health and optimizing user experiences. Internally, Splunk leverages its own suite of products, including APM and RUM, to monitor and enhance its service offerings. The utilization of these tools within the growth engineering team is shared, demonstrating the tangible advantages of APM and RUM.
APM and RUM collectively provide comprehensive visibility into how services perform and how users interact with applications. By integrating both front-end and back-end monitoring, teams can rapidly identify and resolve issues, often before they significantly impact users. These tools offer capabilities ranging from detailed waterfall charts of user interactions to real-time correlation of traces, which are instrumental in accelerating troubleshooting efforts.
Splunk's internal stories serve as a testament to the effectiveness of APM and RUM. One case study highlights the ability of RUM to detect and address a failure in website sign-up forms, allowing for a swift resolution that was three times faster, thereby preserving the company's brand reputation.
Another example showcases how APM enabled the back-end engineering team to maintain a 99.9% uptime and improve engineering productivity by 50% despite increased traffic.
The integration of APM with RUM is particularly beneficial, as it connects front-end user experiences with back-end service performance, providing a holistic view of the system. This end-to-end visibility is crucial for monitoring complex ecosystems, such as Splunk.com, with its multitude of endpoints. By using APM and RUM in unison, teams can now monitor and optimize Splunk's digital ecosystem more efficiently.
The success of APM and RUM integration at Splunk is quantifiable, with impressive key performance indicators (KPIs) such as a 50% faster page load times, a 25% increase in engineering efficiency, and a 60% improvement in core web vitals.
These statistics underline the transformative impact of Splunk's observability tools in creating resilient digital experiences and fostering a forward-thinking approach to service health management.
Understanding APM and RUM Capabilities for Optimized User Experience
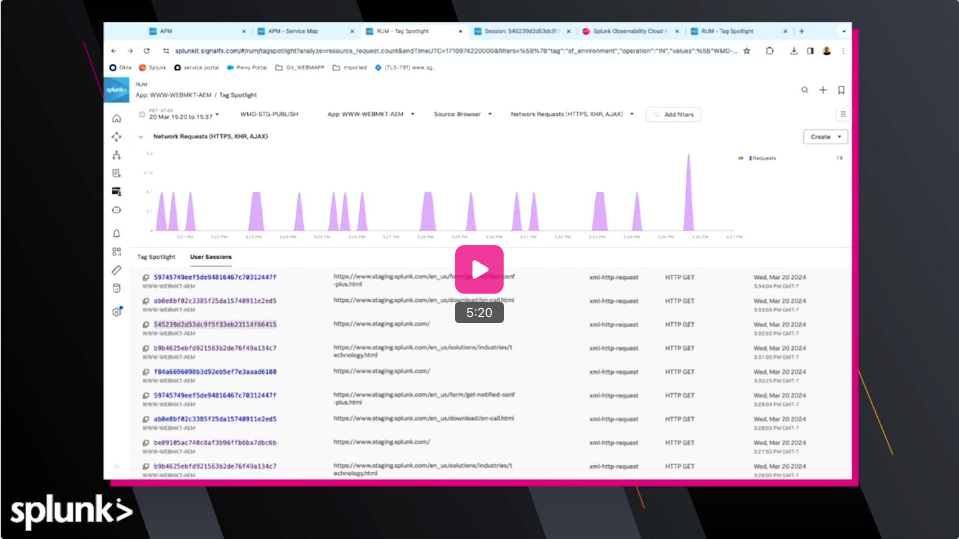
Maximizing User Satisfaction and Business Goals With APM and RUM Correlation
Discover how the correlation of Application Performance Monitoring (APM) and Real User Monitoring (RUM) provides end-to-end visibility, effective root cause analysis, and improved performance optimization. Watch now
Enhancing Digital Experiences with APM and RUM
The implementation of Splunk Application Performance Monitoring (APM) and Splunk Real User Monitoring (RUM) within growth engineering teams has led to significant advancements in page load times and engineering efficiency. Through the implementation of these tools, businesses have observed a significant enhancement in core web vitals and the ability to proactively identify issues.
This shift towards a more foresighted approach has been facilitated by the adoption of observability, resulting in a transformation of operational strategies.
The integration of APM and RUM has empowered teams to gain comprehensive insights into both front-end and back-end systems, enabling a unified approach to issue resolution. This has led to a more efficient and effective method for addressing incidents, with teams now able to quickly zoom in on the performance of critical workflows and preemptively address potential issues before they escalate.
The success stories shared emphasize how APM and RUM have revolutionized the monitoring and optimization of digital services, ensuring high availability and optimal performance. These tools not only provide real-time visibility into user experiences but also facilitate faster troubleshooting and resolution, ultimately enhancing the digital experience for both users and the organization.
Conclusion
In conclusion, the implementation of Application Performance Monitoring (APM) and Real User Monitoring (RUM) is demonstrated to be essential for achieving digital resilience. Enhanced user experiences and operational efficiency are achieved through the adoption of these monitoring tools. Organizations are empowered to proactively identify and resolve issues, thereby maintaining high service uptime and improving core web vitals.
The integration of APM and RUM enables a seamless correlation between user interactions and application performance, offering a comprehensive observability solution. This approach results in significant improvements in page load times and engineering productivity. By leveraging the capabilities of APM and RUM, a transformation in incident management is facilitated, transitioning from a reactive to a preemptive stance in digital service delivery.
Speakers
- Sudhaker Adusumilly, Senior Director, Head of Growth Engineering, Splunk
- Sandeep Kampa, Sr DevOps Engineer, Growth Engineering, Splunk
Looking for More? Watch the full Demo
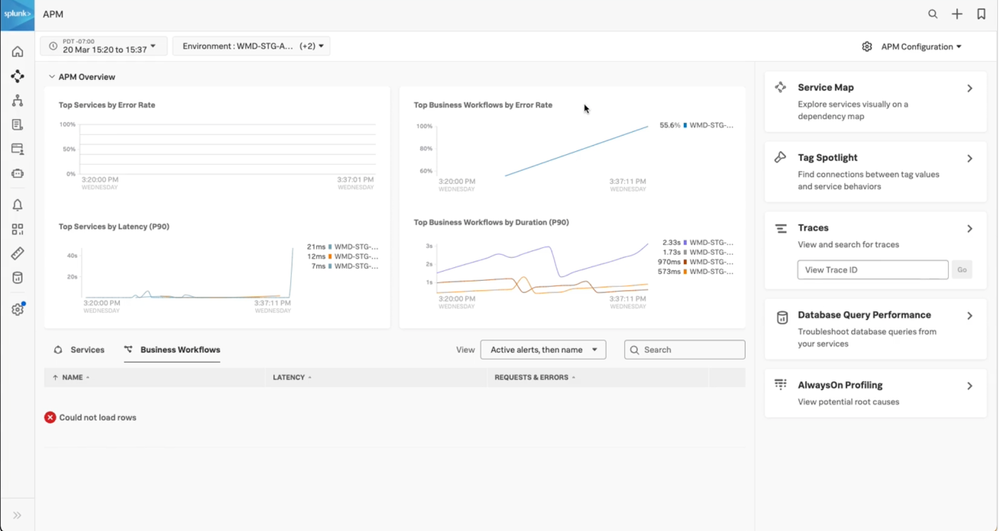
In this demo, Sandeep Kampa, Sr DevOps Engineer at Splunk discusses the powerful capabilities of Splunk APM and RUM, demonstrating how they can revolutionize application performance and user experience. He showcases key features such as service maps, error tracking, and the correlation between APM and RUM for comprehensive front-end and back-end analysis. The walkthrough includes a practical example of troubleshooting a real-world issue with the integrated tools, highlighting their ability to reduce resolution time and improve operational efficiency. Watch now
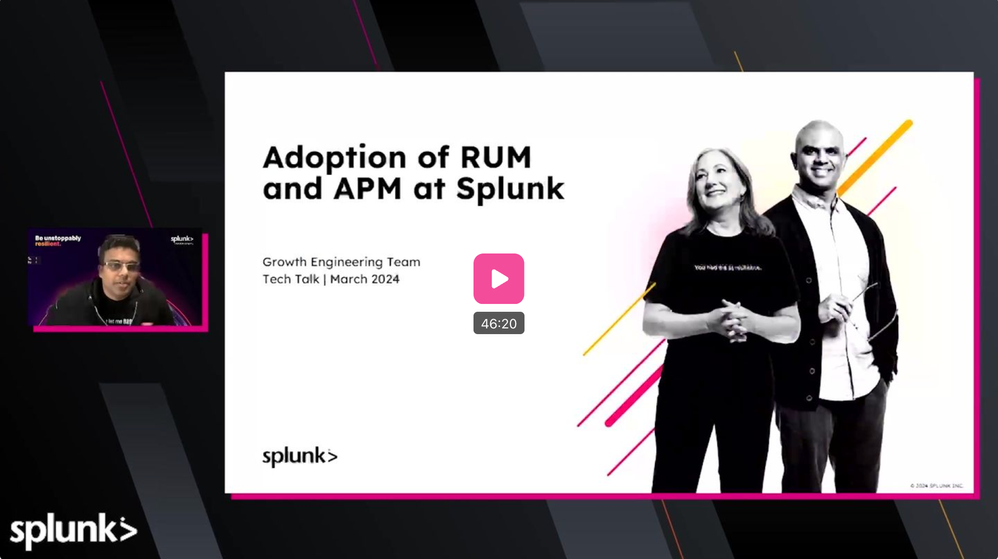
Watch the full Tech Talk
You must be a registered user to add a comment. If you've already registered, sign in. Otherwise, register and sign in.
Index This | Forward, I’m heavy; backward, I’m not. What am I?
A Guide To Cloud Migration Success
Join Us for Splunk University and Get Your Bootcamp Game On!
-
.conf20
9 -
.conf21
9 -
.conf22
13 -
.conf23
13 -
.conf24
3 -
BSides
9 -
Community Digest
20 -
Customer Experience
32 -
D&Data Monsters
5 -
Humans That Splunk
19 -
MVP
6 -
Office Hours
2 -
OpenTelemetry
19 -
other
8 -
Product Announcements
20 -
Splunk Answers
41 -
Splunk Careers Report
13 -
Splunk Community
15 -
Splunk Education
48 -
Splunk Ideas
12 -
Splunk Lantern
31 -
Splunk Love
14 -
SplunkTrust
25 -
Tech Talks
12 -
User Groups
35
- « Previous
- Next »
